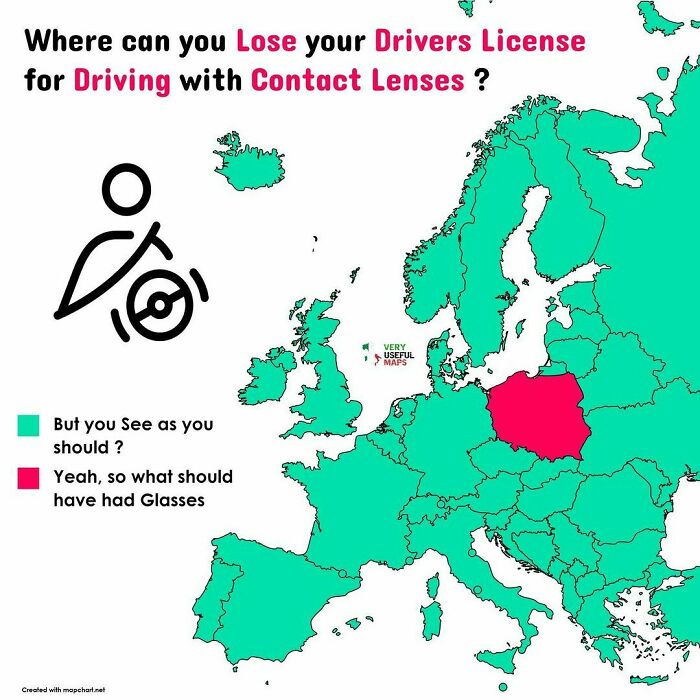
Created by the mastermind behind the ‘Very Useful Maps’ account, these images are not your regular markers of geographic areas; they are mirrors of cultural phenomena, eating habits, all things nature, and so much more, so scroll down to find them and see for yourself just how amusing and fun geography can be. If you scroll down, you will also find Bored Panda’s interview with assistant professor of geography at University of Oregon and an academic expert in climate change communication, cartography, map design and mapping environment-society interactions, Carolyn Fish, who was kind enough to delve deeper into the topic of maps with us. “I knew that map accounts existed and, well, on New Year’s Eve, I decided ‘yeah, let’s do it and see how it will go’,” they wrote. Discussing where they draw inspiration from for their maps, the mastermind behind the account revealed that it varies; sometimes an idea would pop up randomly and they would note it down for later use, but sometimes they would have to try and come up with something as they were working on the project. “Sometimes it’s hard to come up with something, so I go for something that has been done [already], but I try to expand it,” they shared. “There are a lot of arguments about when the first maps came to be, with some scholars arguing that maps in some form have existed since ancient Mesopotamia and others arguing that they are a more recent invention that goes back still hundreds of years, but not millennia,” she told Bored Panda. “The old road atlas you might have kept in your car, or the newer Google or Apple maps on your phone, are both examples of reference maps. Reference maps, I would argue, have existed for millennia. People have been taking their own mental maps of their world and putting that spatial information down in the dirt or later on paper for thousands of years. “Thematic maps are considered far more recent inventions, and these maps have grown in popularity, especially in recent decades because we have access to so much data that it makes sense to represent that in a spatial form, i.e., a map,” the asst. prof. of geography explained. “First, the data needs to be interesting. In the ‘Very Useful Map’ Instagram account the maps are primarily of thematic data, so assuring that the data that you are showing is something people would be interested in knowing is important,” Fish suggested. “Second, aesthetics are really important, especially on platforms like Instagram. While the platform has changed a lot over the years from moving away from static photos, the accounts that still focus on those static images have always been thinking about how aesthetics are key to getting followers. Maps can be beautiful and I think focusing on sharing beautiful maps is vital to growing a following.” Thanks to technology, people nowadays have access to all sorts of engaging ways to learn new information, from games to cartoons, and beyond. While for some people, reading a book can be equally exciting, for those finding it easier to focus on something more colorful, vivid or interactive, it can be a game changer in learning. “While personal experience with other social groups and cultures is the pinnacle of building mutual understanding between groups, maps are a great way for people to begin to understand the world around them, including the differences (and similarities) across different cultures and groups. And getting access to maps, especially for those of us in the Global North, is easier than traveling all around the world, nevermind that it is more climate friendly,” Asst. Prof. Carolyn Fish suggested. “There is a great book called ‘How to Lie with Maps’ by Mark Monmonier which talks about the ability to easily manipulate data and information to tell different stories in maps. A lot of my recent research has explored how people might be doing this with climate change maps. Humans have this tendency to trust maps more than they trust other information, so just being cognizant of our biases is helpful when viewing maps these days. “My research has shown that typically there is not ill-intention on the part of the mapmaker, but we, as map readers, should all be looking at maps and thinking: about where the data comes from, who had a stake in creating it, what mistakes could have been made in the creation of the map, and how was the data made into information that is viewable in this type of graphic.” Follow Bored Panda on Google News! Follow us on Flipboard.com/@boredpanda! Please use high-res photos without watermarks Ooops! Your image is too large, maximum file size is 8 MB.