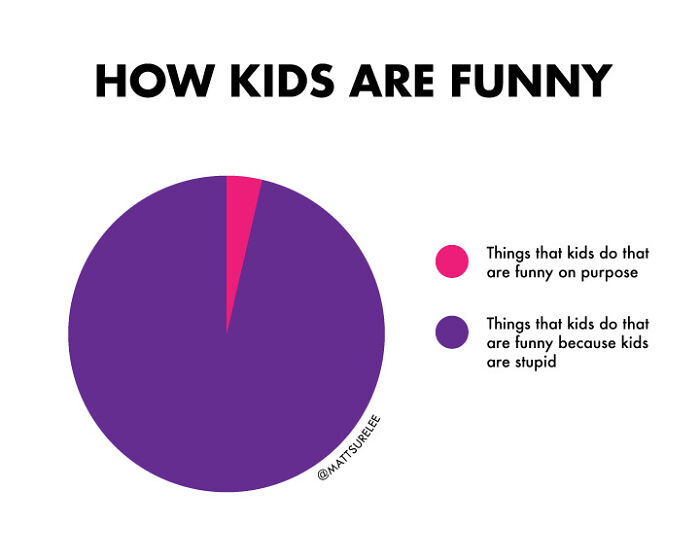
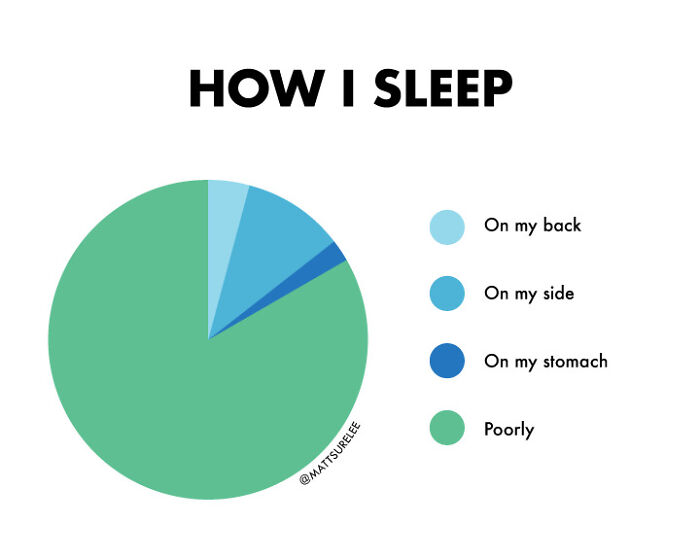
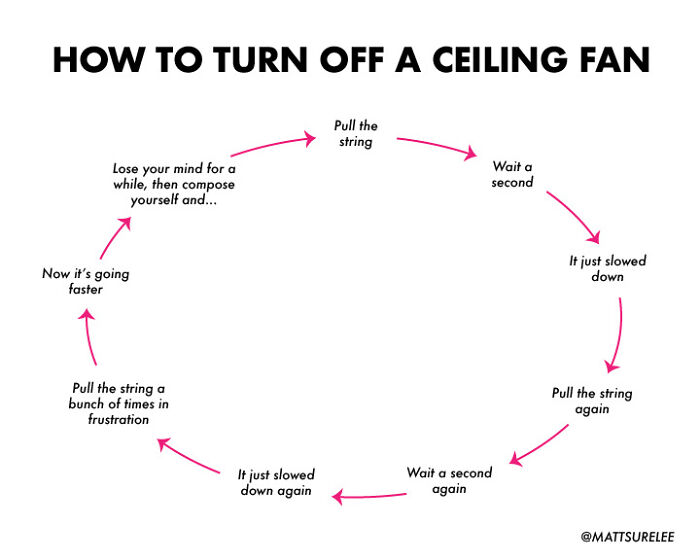
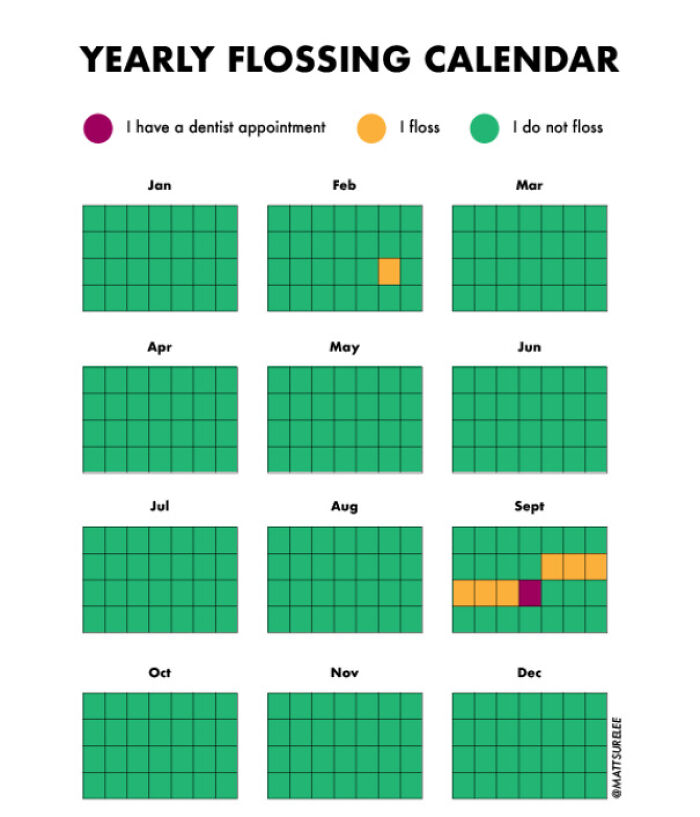
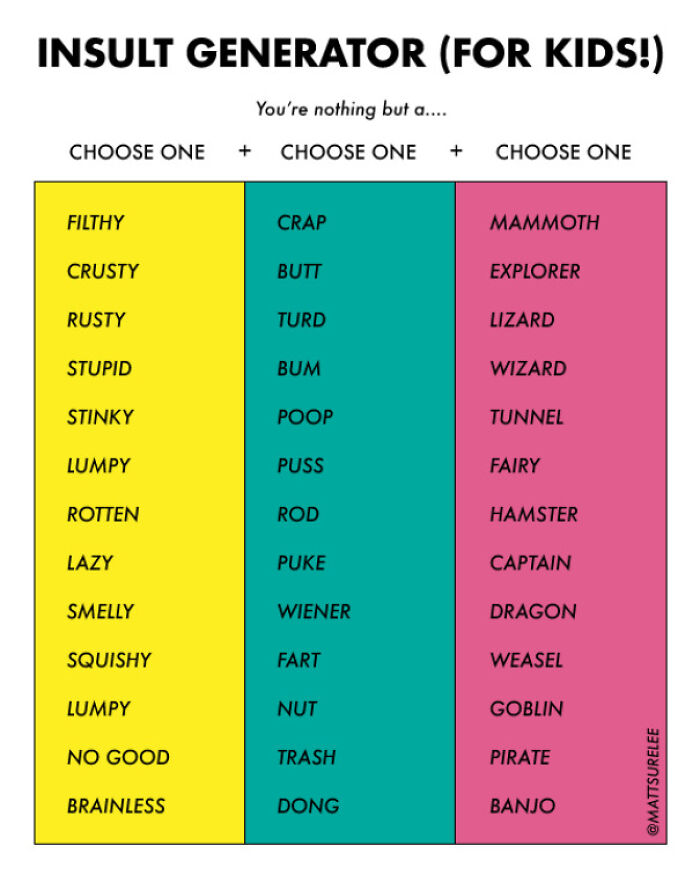
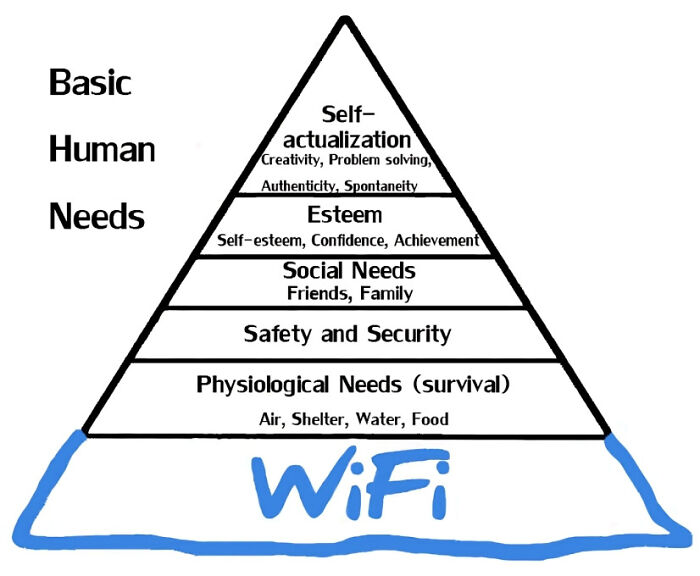
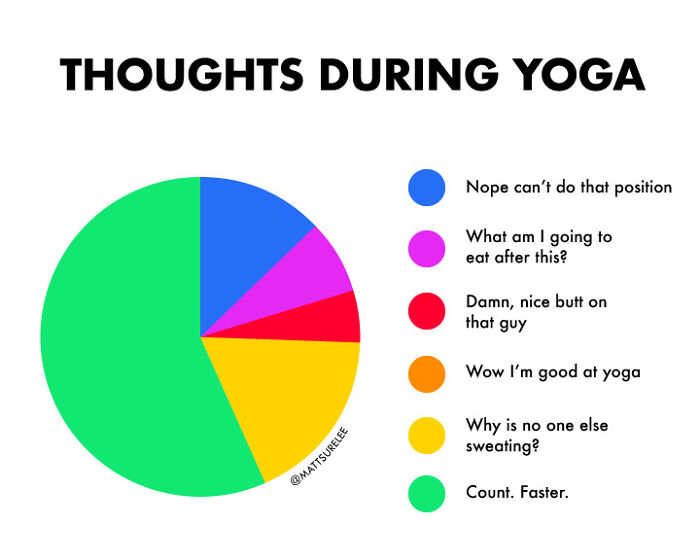
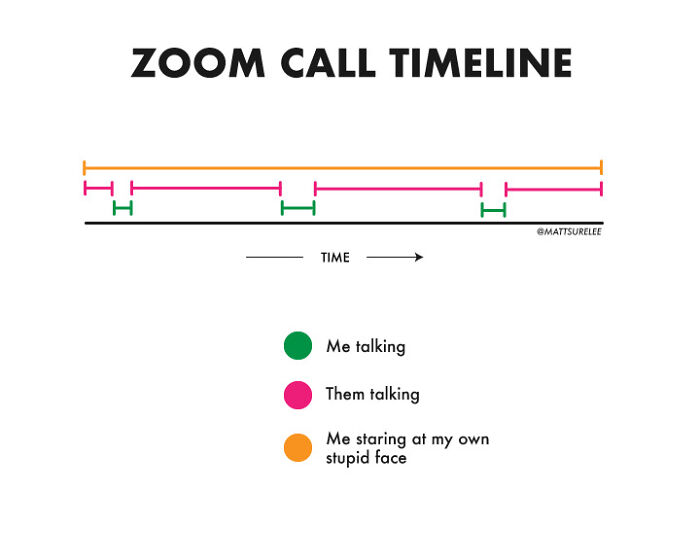
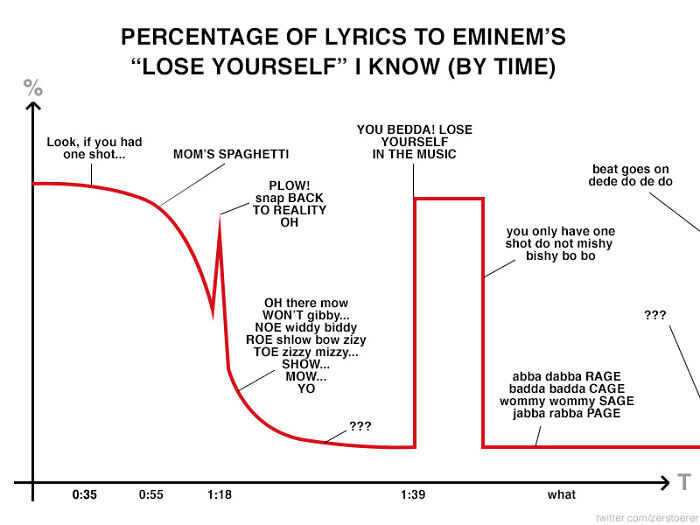
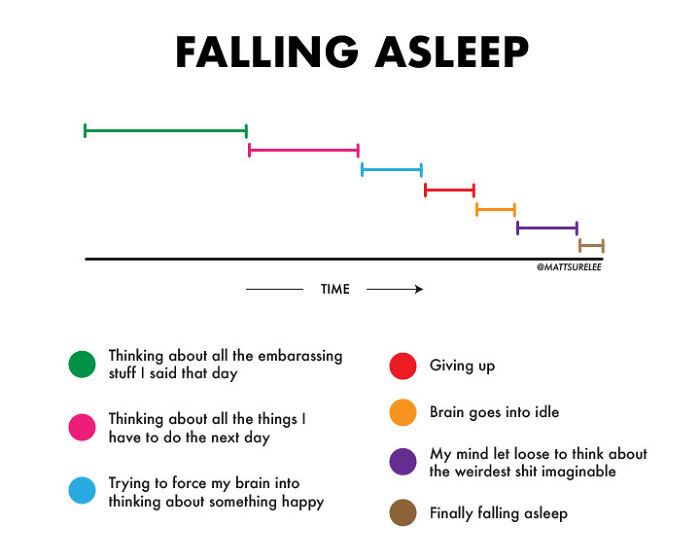
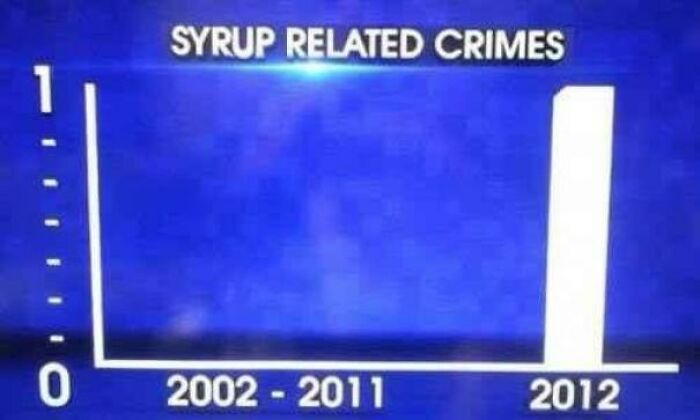
The “Funny Charts” online group is dedicated to amusing, creative, and informative graphs that attempt to mix data with humor. From helpful guides to assist in creating insults, to statistical breakdowns of Eminem’s songs, get comfortable as you scroll through, upvote your favorites, and be sure to share your thoughts in the comments section. After all, memes tend to use standard, recognized layouts to communicate the joke. This is just as true for graphs, which need to have certain attributes to even function. Despite their reputation as a dry, analytical tool, it’s worth giving graphs and charts a second chance. Indeed, unlike “raw” text, it’s a pretty visual way to showcase information. Follow Bored Panda on Google News! Follow us on Flipboard.com/@boredpanda! Please use high-res photos without watermarks Ooops! Your image is too large, maximum file size is 8 MB.